Distance metric and classifier plots
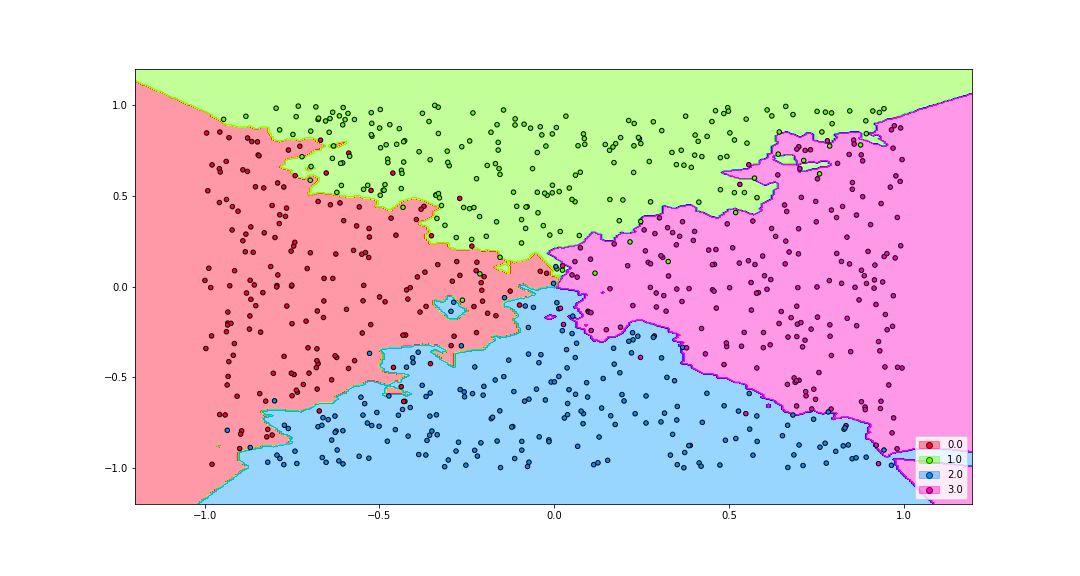
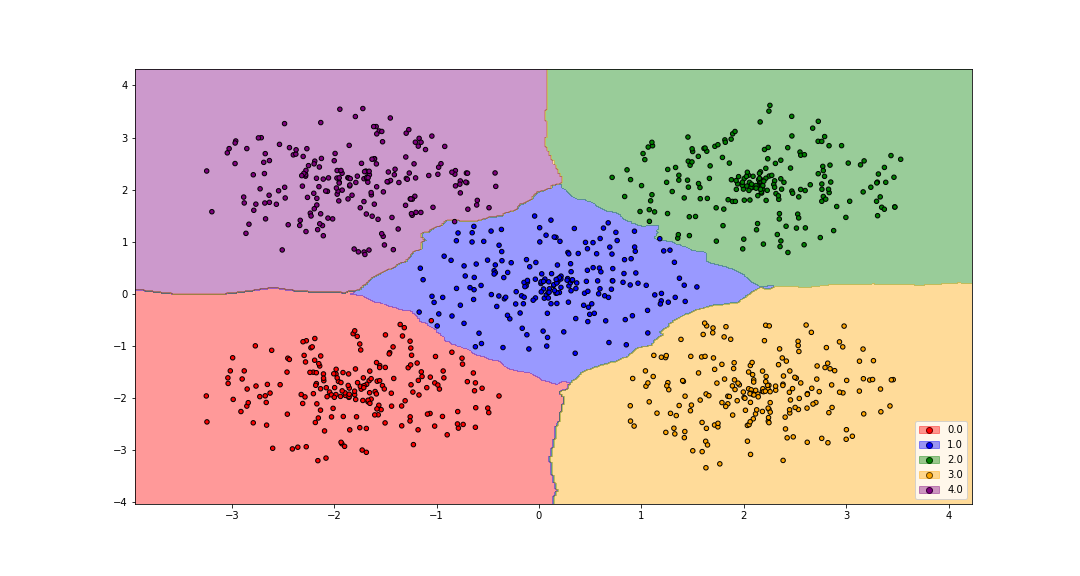
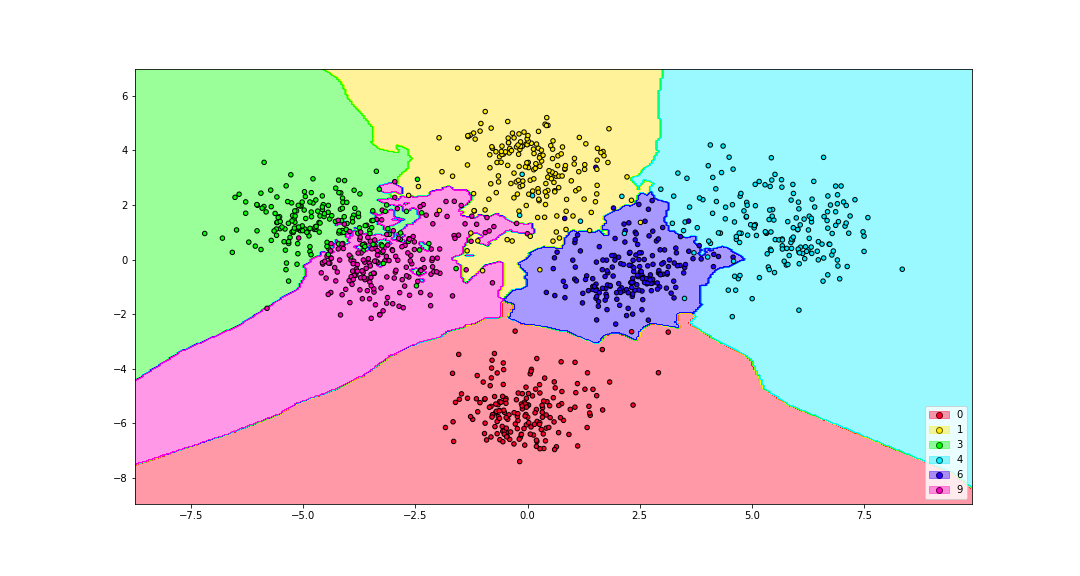
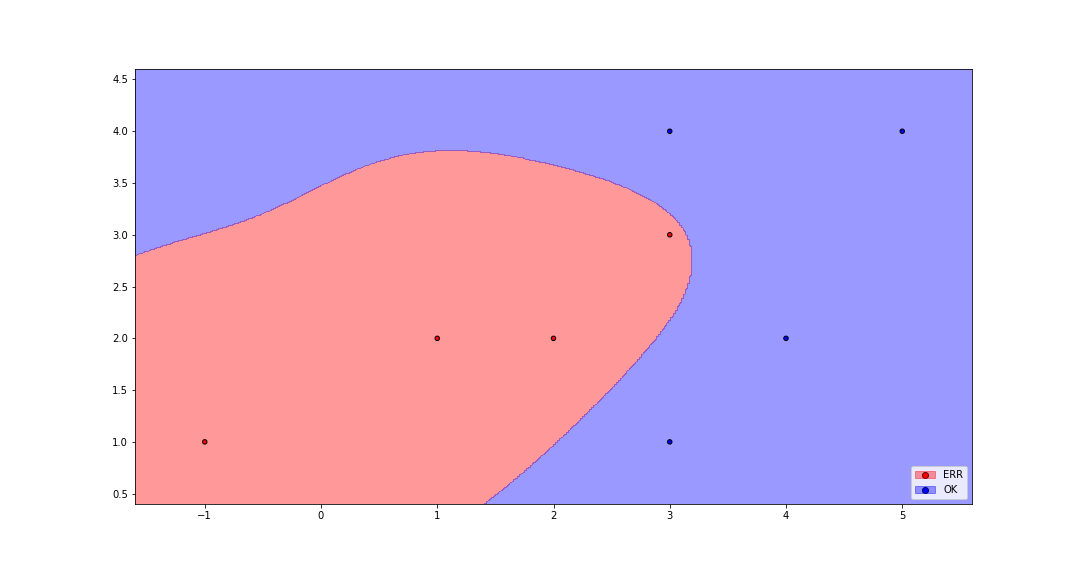
The module dml_plot provides several functions for plotting the regions determined by a classifier and by a distance metric learning combined with a classifier. The classifier_plot function allows to plot the class regions determined by any classifier. With the dml_plot function, a metric can be added to modify the classifier region. This metric can be added via a linear transformation, a metric PSD matrix or a distance metric learning algorithm that will learn it. A special function, when the classifier is the nearest neighbors classifier, is also available. Use in this case knn_plot.
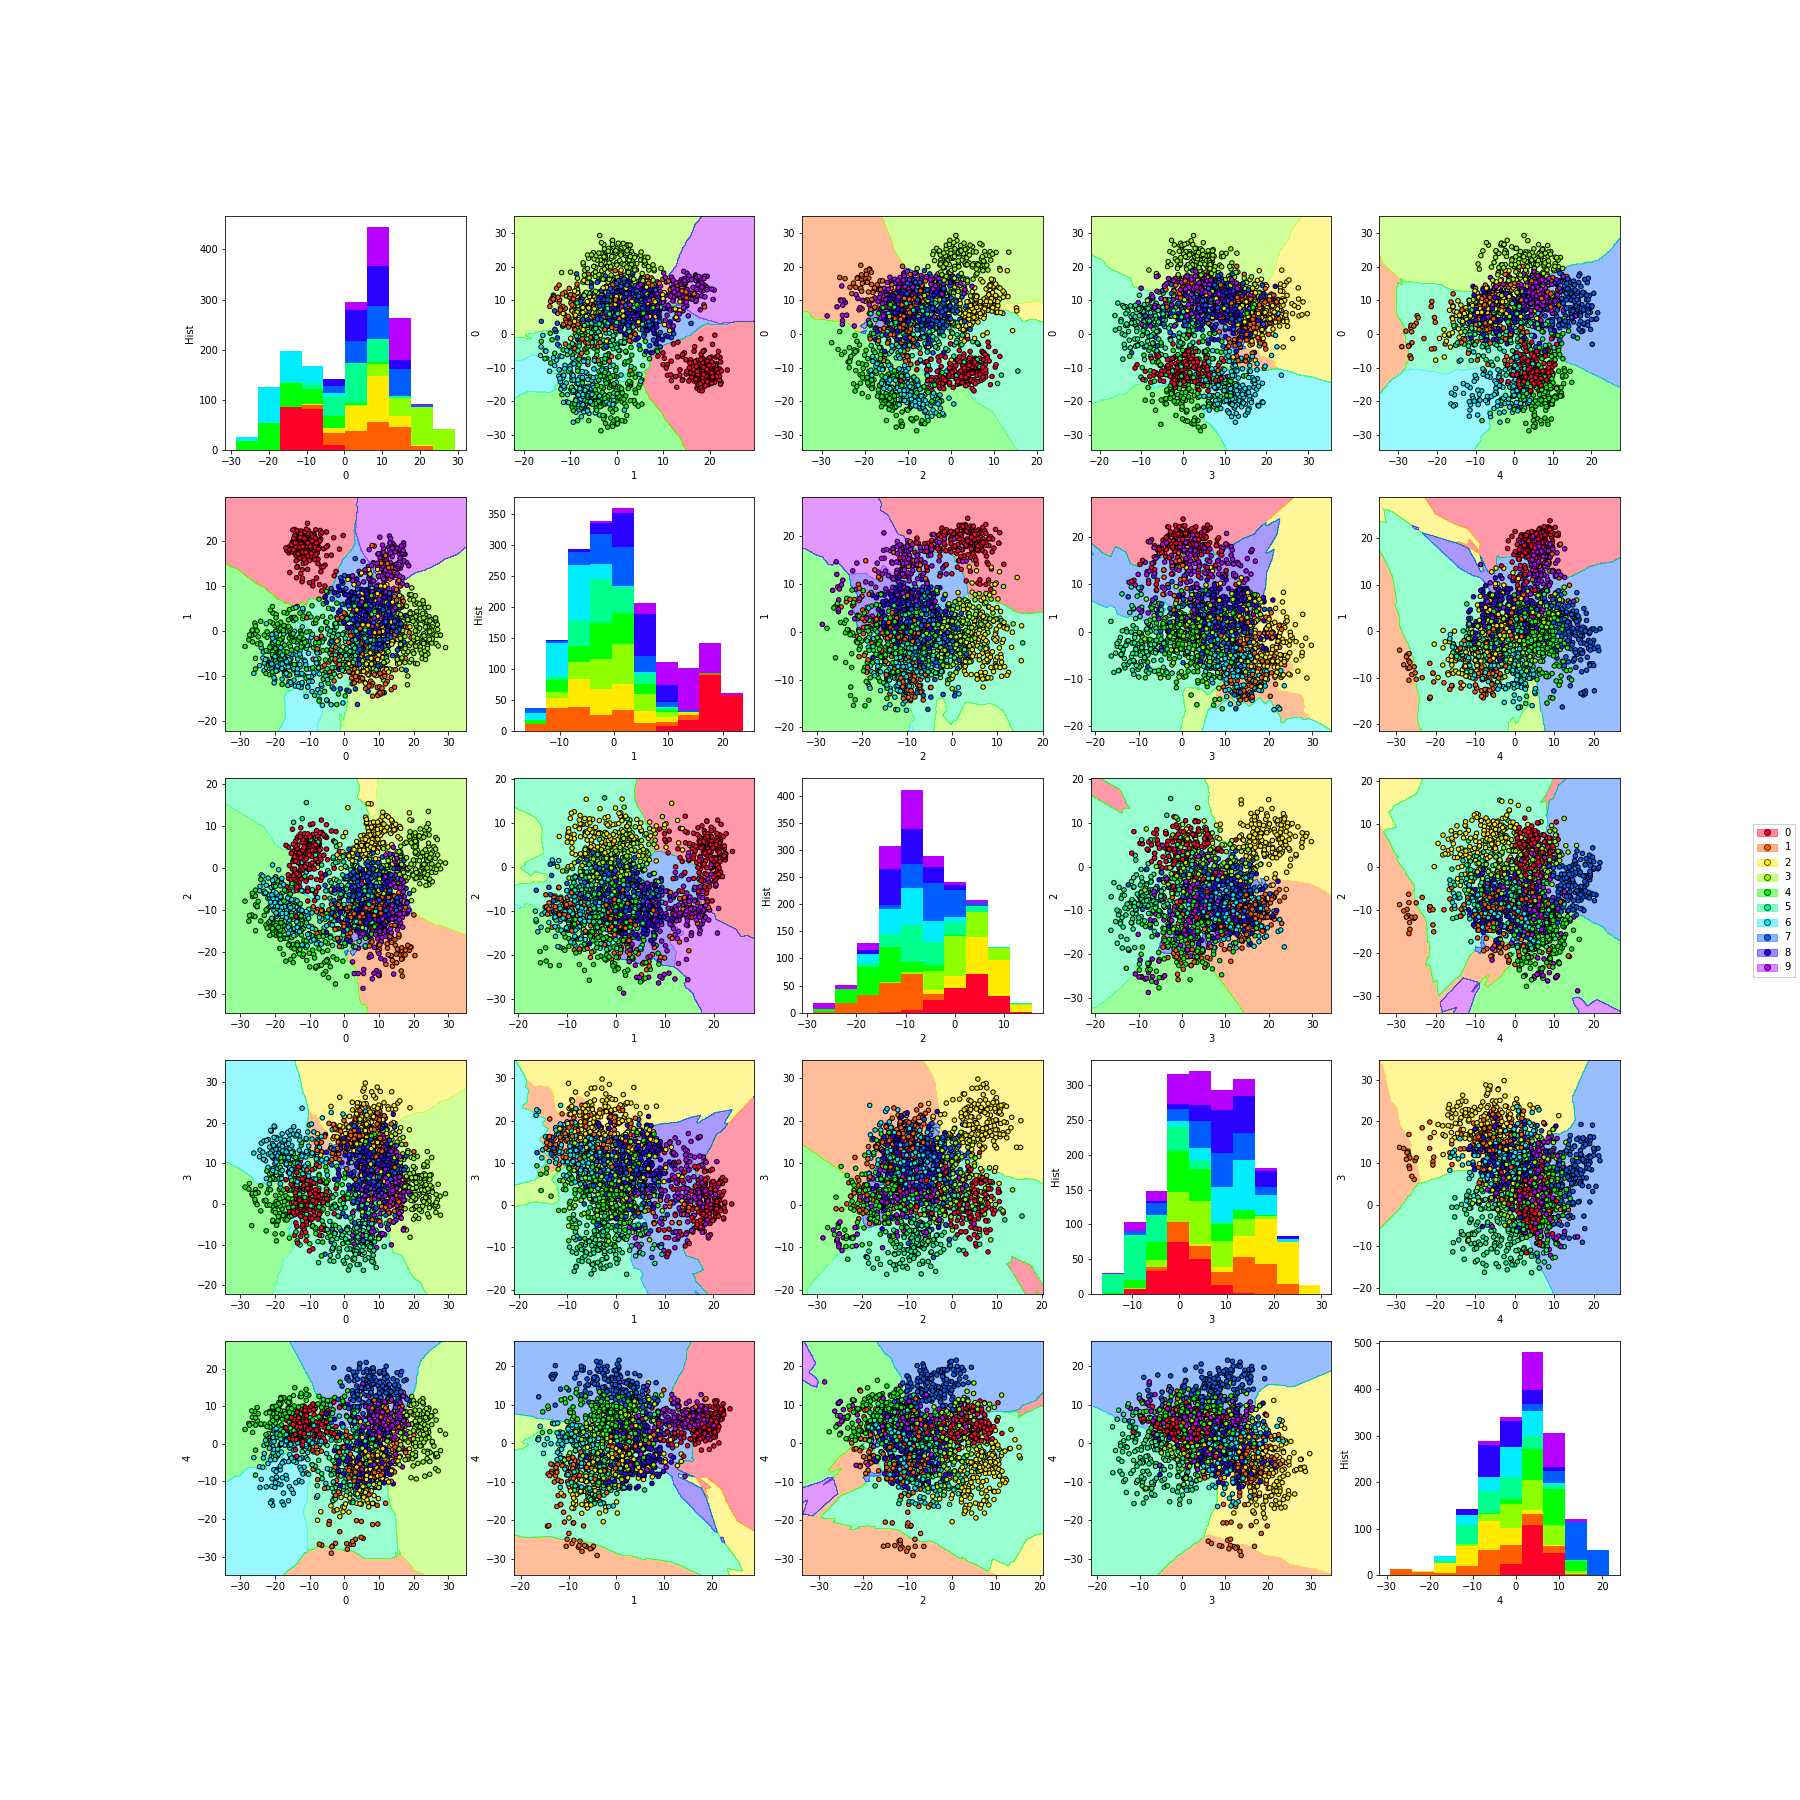
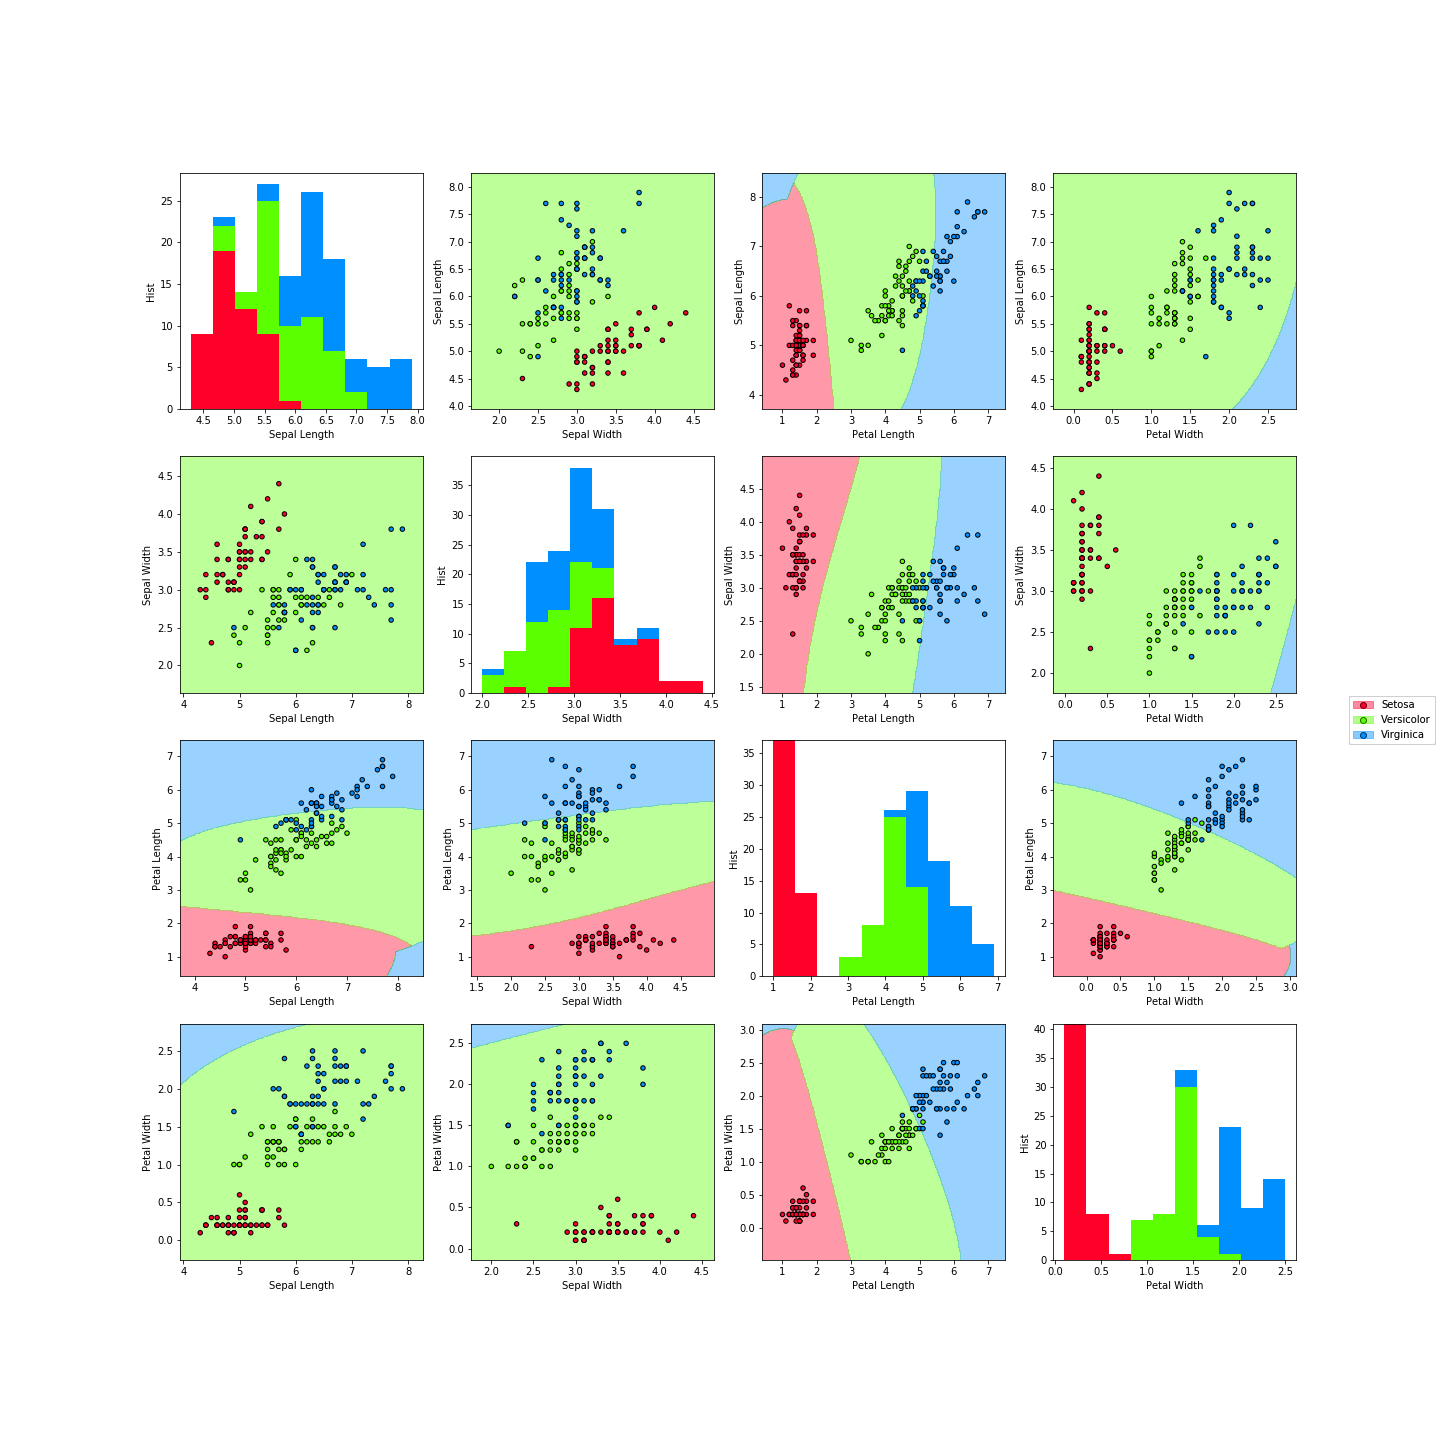
Analogous versions of the previous functions are available to plot simultaneously different pairs of attributes. For this case, watch the functions classifier_pairplots, dml_pairplots and knn_pairplots. Multiple plots, considering different classifiers or distances, can be done with the function dml_multiplot. There is also a 3D classifier plot (still in development), see classifier_plot_3d.
All these libraries use internally Python’s matplotlib library.